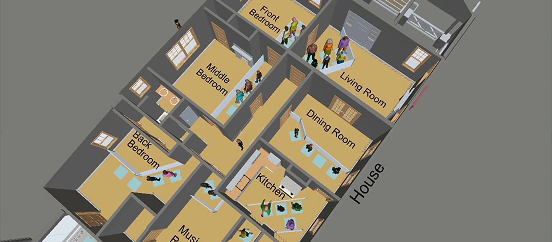
The Henry Ford Jackson Home Visitor Flow Simulation
ROLE
UX Researcher | Experience Design
METHODS
Behavioral Observation • Space Syntax Analysis • Behavioral Path Clustering • Visitor Segmentation • Discrete Event Simulation • Predictive Modeling
SETTING
The Henry Ford, Greenfield Village
01
Project Overview
The Dr. Sullivan and Mrs. Richie Jean Sherrod Jackson Home is a nationally significant historic residence associated with the 1965 Selma to Montgomery marches, where civil rights leaders, including Dr. Martin Luther King Jr., gathered to develop strategies that contributed to the passage of the Voting Rights Act. After being relocated to Greenfield Village at The Henry Ford museum, the home was prepared to open to the public as a permanent exhibition in Summer 2026.
As the first building added to Greenfield Village in more than forty years, there was no historical visitor data to guide operational planning. My role was to develop a predictive visitor flow model that would forecast how guests would move through the constrained historic space before opening day.
Using UX research methodologies and behavioral modeling, I created a visitor simulation that allowed stakeholders to evaluate different ticketing strategies, estimate visitor capacity, identify potential congestion points, and determine where presenters should be positioned to create a comfortable and engaging visitor experience.
02
The Challenge
Narrow circulation paths
Limited room capacity
Sequential visitor movement
Preservation requirements that prevented structural modifications
No behavioral data existed, planning visitor capacity relied on assumptions rather than evidence. The home's preserved architectural layout introduced additional constraints:
The challenge became:
How might we predict visitor behavior and optimize the museum experience before the exhibition opened to the public?
03
Research Questions
To support exhibition planning, I focused on answering several key research
questions.
Visitor Experience
How long will visitors spend inside the home?
Where are visitors most likely to stop or experience congestion?
What will waiting times look like throughout the experience?
Capacity Planning
How many visitors can comfortably occupy both the Jackson Home and Annex (complimentary building with digital interactives) without overcrowding?
Should visitors enter through 15-minute or 30-minute ticketing windows?
Can walk-up visitors be accommodated without negatively affecting the experience?
Operations
Where should docents and presenters be positioned to support visitor flow?
What traffic management strategies should staff use during peak attendance?
04
Research Methodology
To support exhibition planning, I focused on answering several key research questions.
Behavioral Observation
I analyzed visitor movement within comparable historical homes and nearby exhibitions at The Henry Ford to understand common behavioral patterns. These observations focused on:
visitor arrival behavior
walking speed
dwell time
congestion points
exhibit engagement
decision-making at transitions between rooms
These findings established the behavioral assumptions used throughout the simulation.
Space Syntax Analysis
In collaboration with our experience design team I evaluated the home's architectural layout to understand how visibility, room connectivity, and circulation paths would naturally influence visitor movement. This helped identify areas likely to become bottlenecks before testing any operational scenarios.
Behavioral Path Clustering
Behavioral observations revealed that visitors interact with museum environments differently depending on their engagement level. We simulate this behavior by randomly assigning a visitor type to each person and then reducing the average view time at each exhibit to give the correct %. This results in a very different time profile for each type of visitor to the Jackson Home: To reflect these differences, visitors were grouped into three behavioral archetypes based on existing museum research and validated using historical attendance patterns from The Henry Ford.
DISTRIBUTION
VISITOR TYPE
CHARACTERISTICS
60%
Strollers
Browse most exhibits with moderate viewing time
10%
Studiers
Read interpretation thoroughly and spend longer in each room
30%
Streakers
Move quickly through the exhibition with minimal stopping
Each simulated visitor was randomly assigned one of these behavioral profiles, allowing the model to better represent realistic variation in visitor behavior.
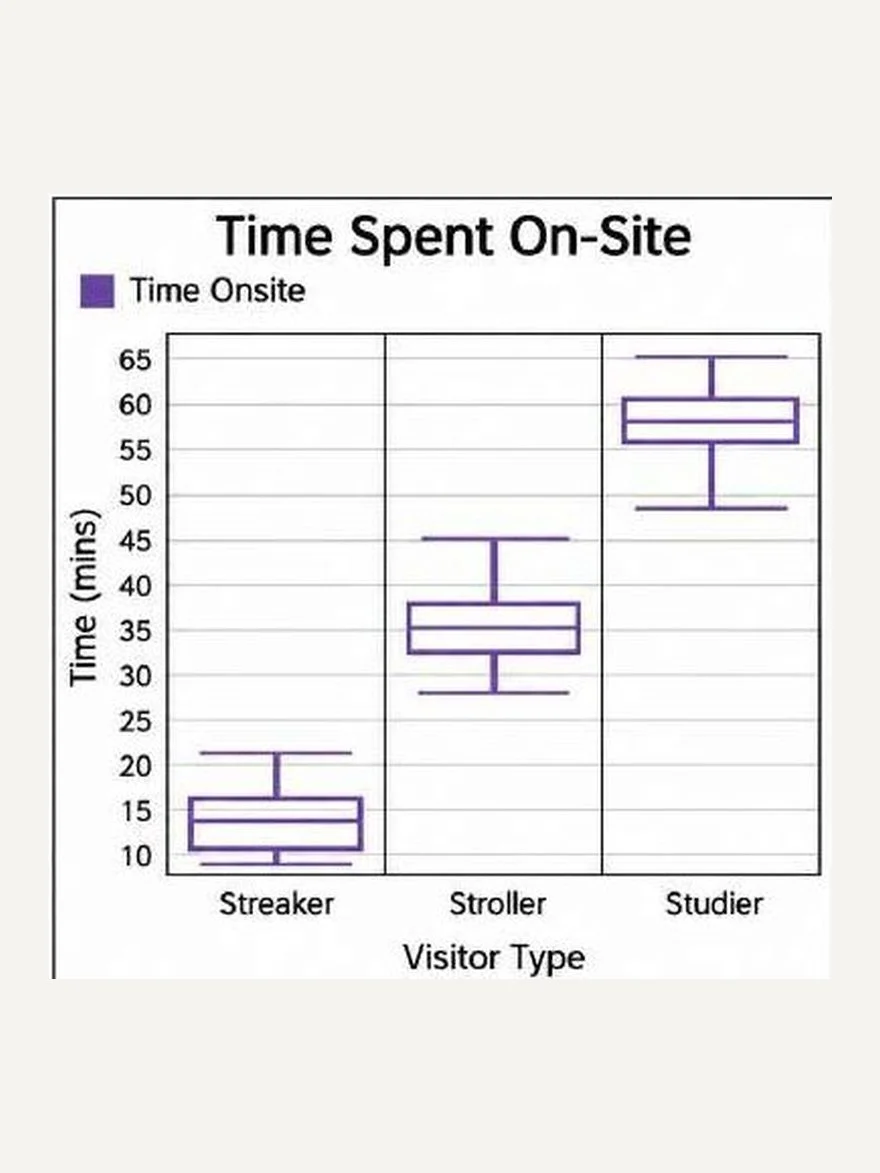
FIG. 01 — TIME SPENT ON-SITE BY VISITOR TYPE
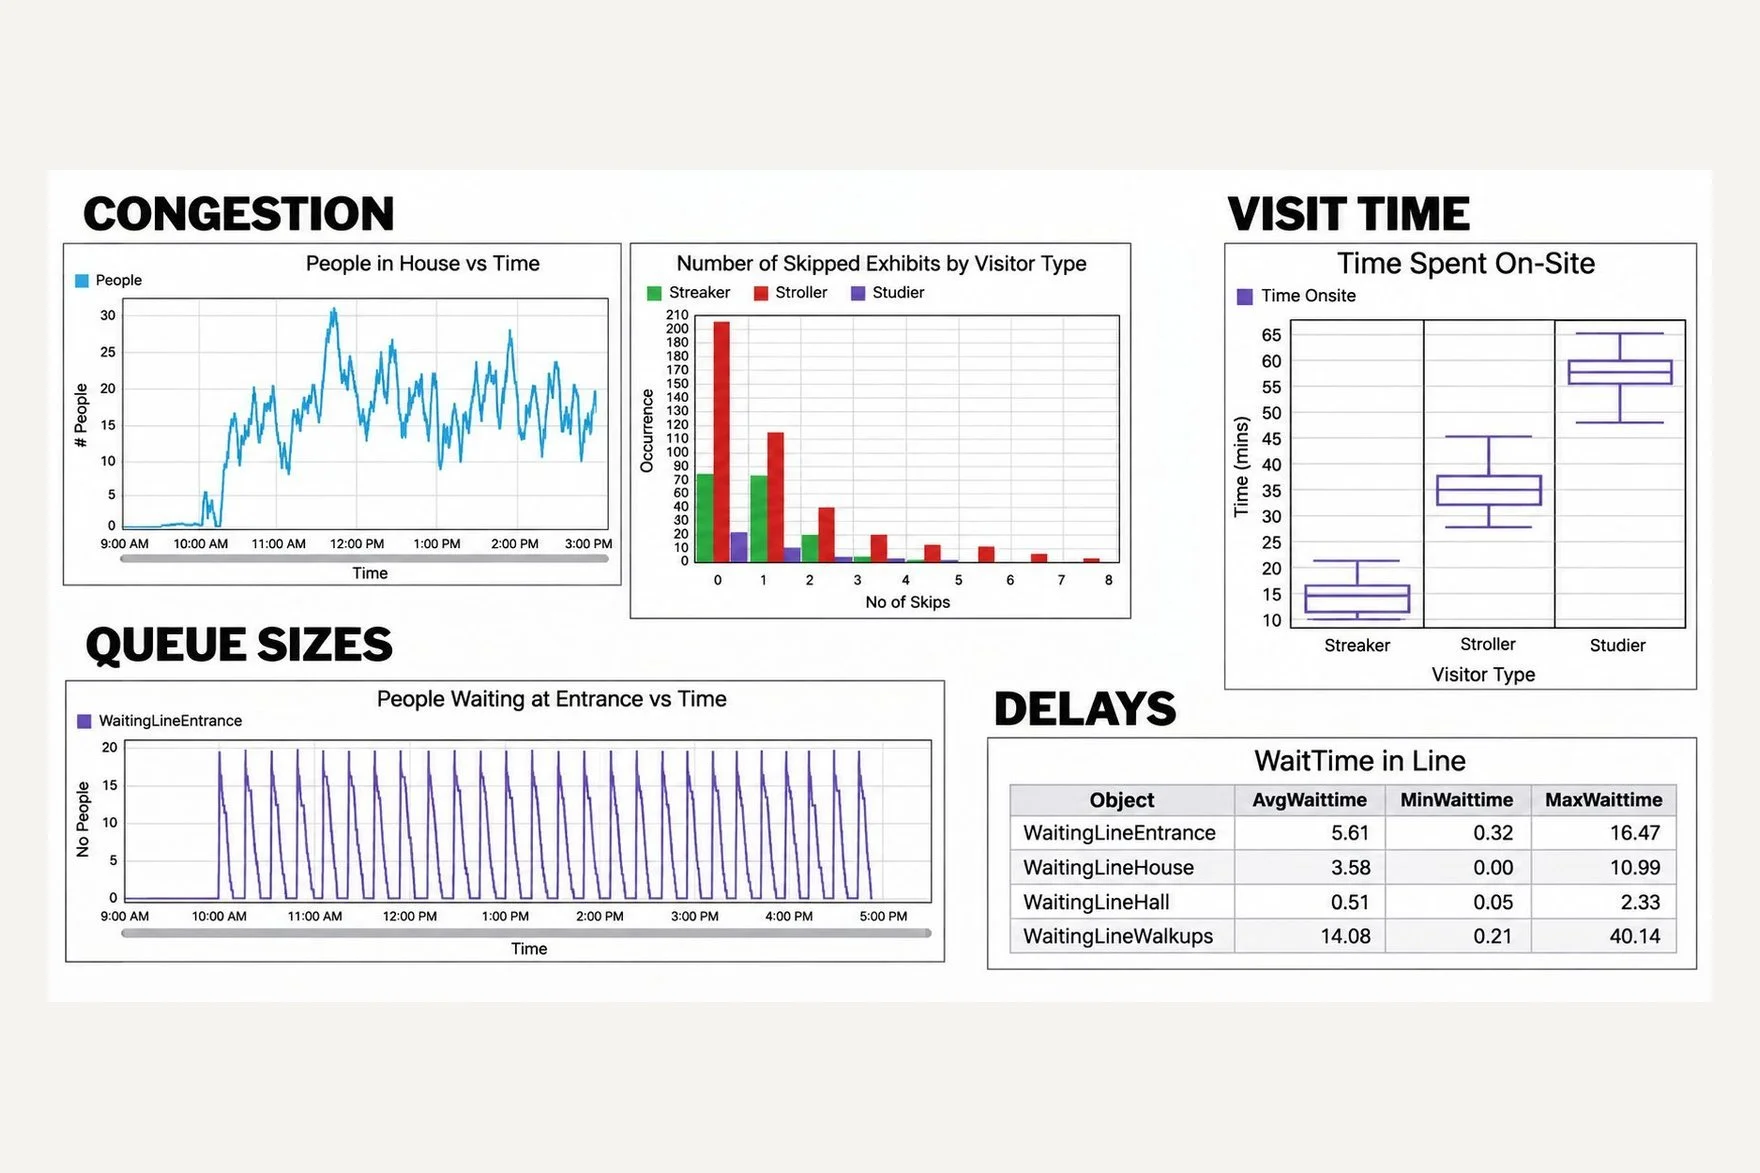
FIG. 02 — CONGESTION, QUEUE SIZES, VISIT TIME AND DELAYS
05
Building the simulation
Using behavioral research, I developed a discrete event simulation that modeled individual visitor movement throughout the exhibition. The simulation followed wayfinding based on the expected paths in the home, displayed below. Each visitor independently navigated the home while interacting with operational constraints including:
timed ticket arrivals
room occupancy limits
queue formation
walking speed
exhibit dwell time
presenter intervention
alternative routing when spaces reached capacity
Rather than moving visitors as a group, every individual made independent movement decisions based on available space and predefined behavioral rules. This allowed the simulation to realistically forecast congestion and visitor flow under multiple operational scenarios.
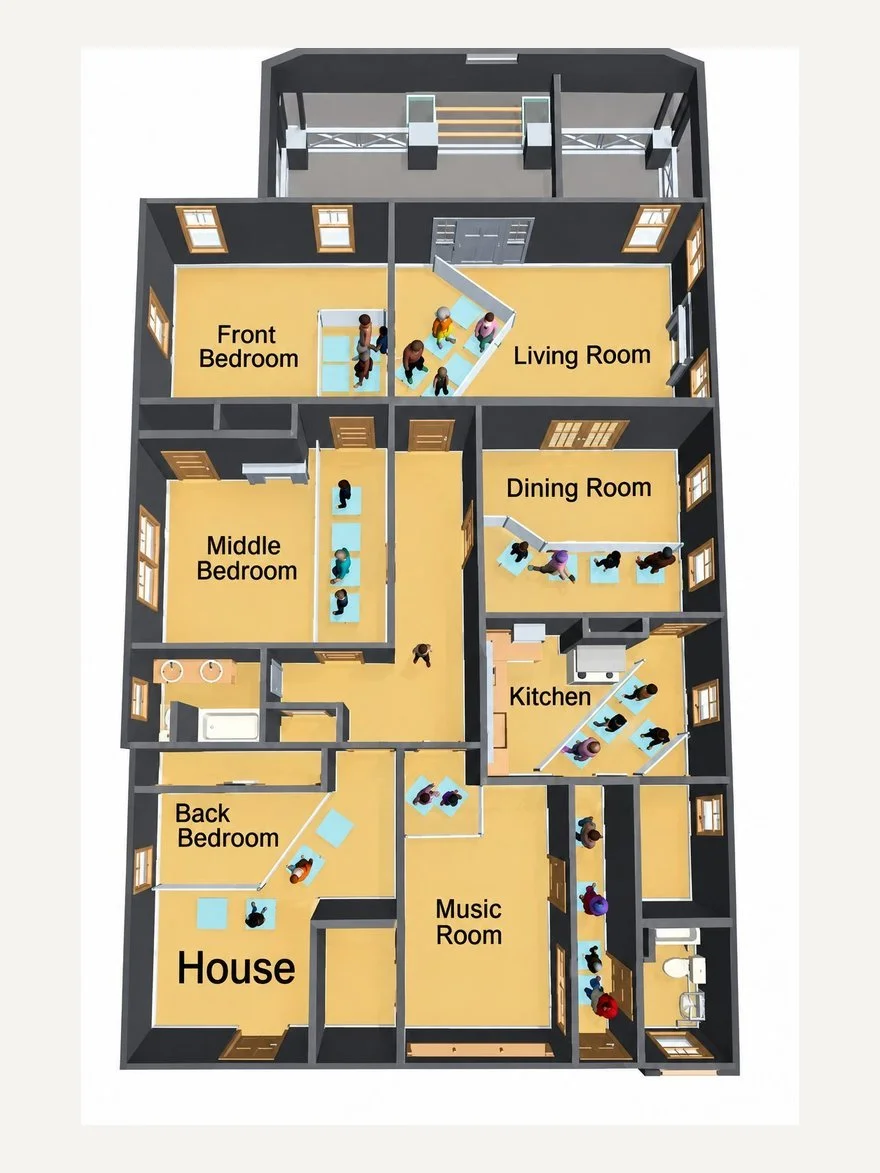
FIG. 03 — JACKSON HOME FLOOR PLAN
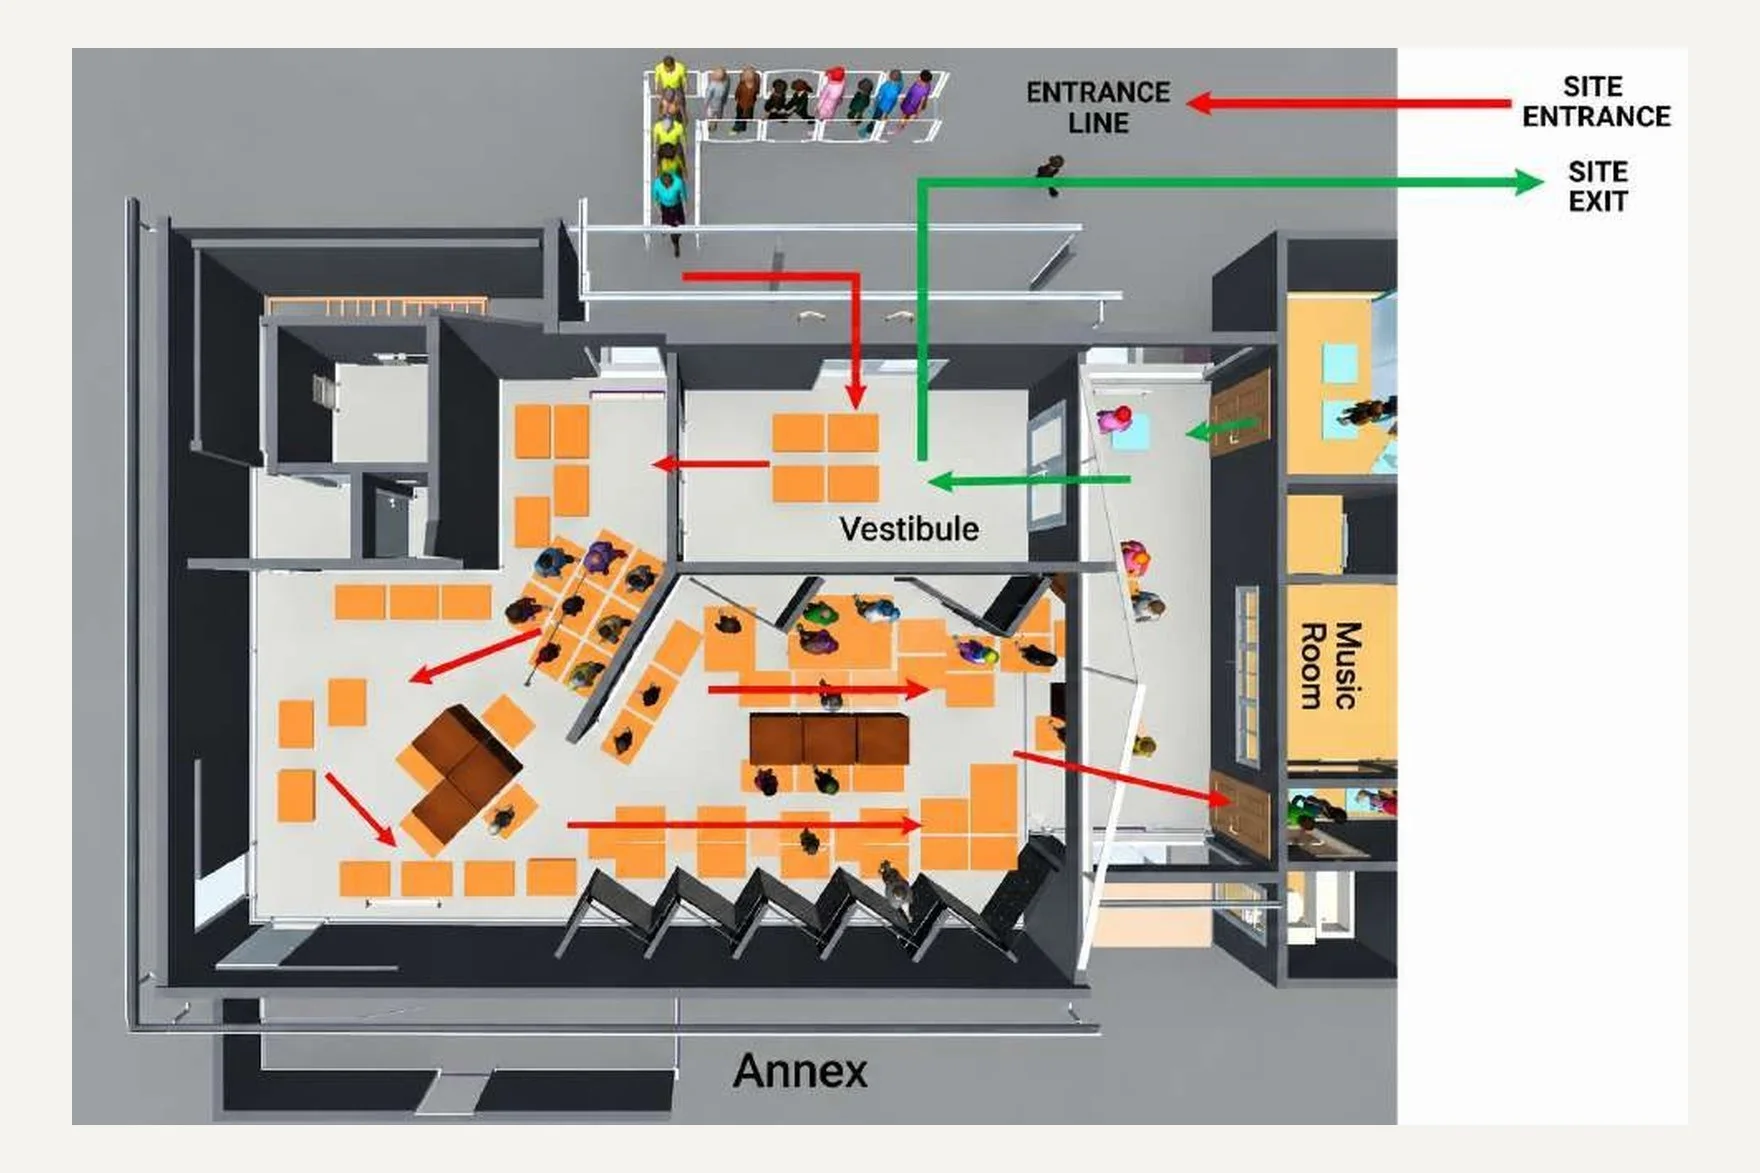
FIG. 04 — THE ANNEX FLOOR PLAN, WITH SITE ENTRANCE, ENTRANCE LINE AND VESTIBULE
06
Baseline Assumptions
Since the exhibition had not yet opened, several assumptions were established using observations from comparable exhibitions. These assumptions provided a consistent foundation for comparing
operational scenarios.
These included:
Visitors arrive within their assigned ticket window.
Ticket windows operate in either 15-minute or 30-minute intervals.
Visitors travel independently while naturally clustering into small social groups.
Average walking speed is approximately 2.0 mph, representing most museum visitors.
Each exhibit has a maximum occupancy determined by available floor space.
When capacity is reached, visitors either wait or continue to another available location.
Individual viewing times vary according to visitor type and natural behavioral variation.
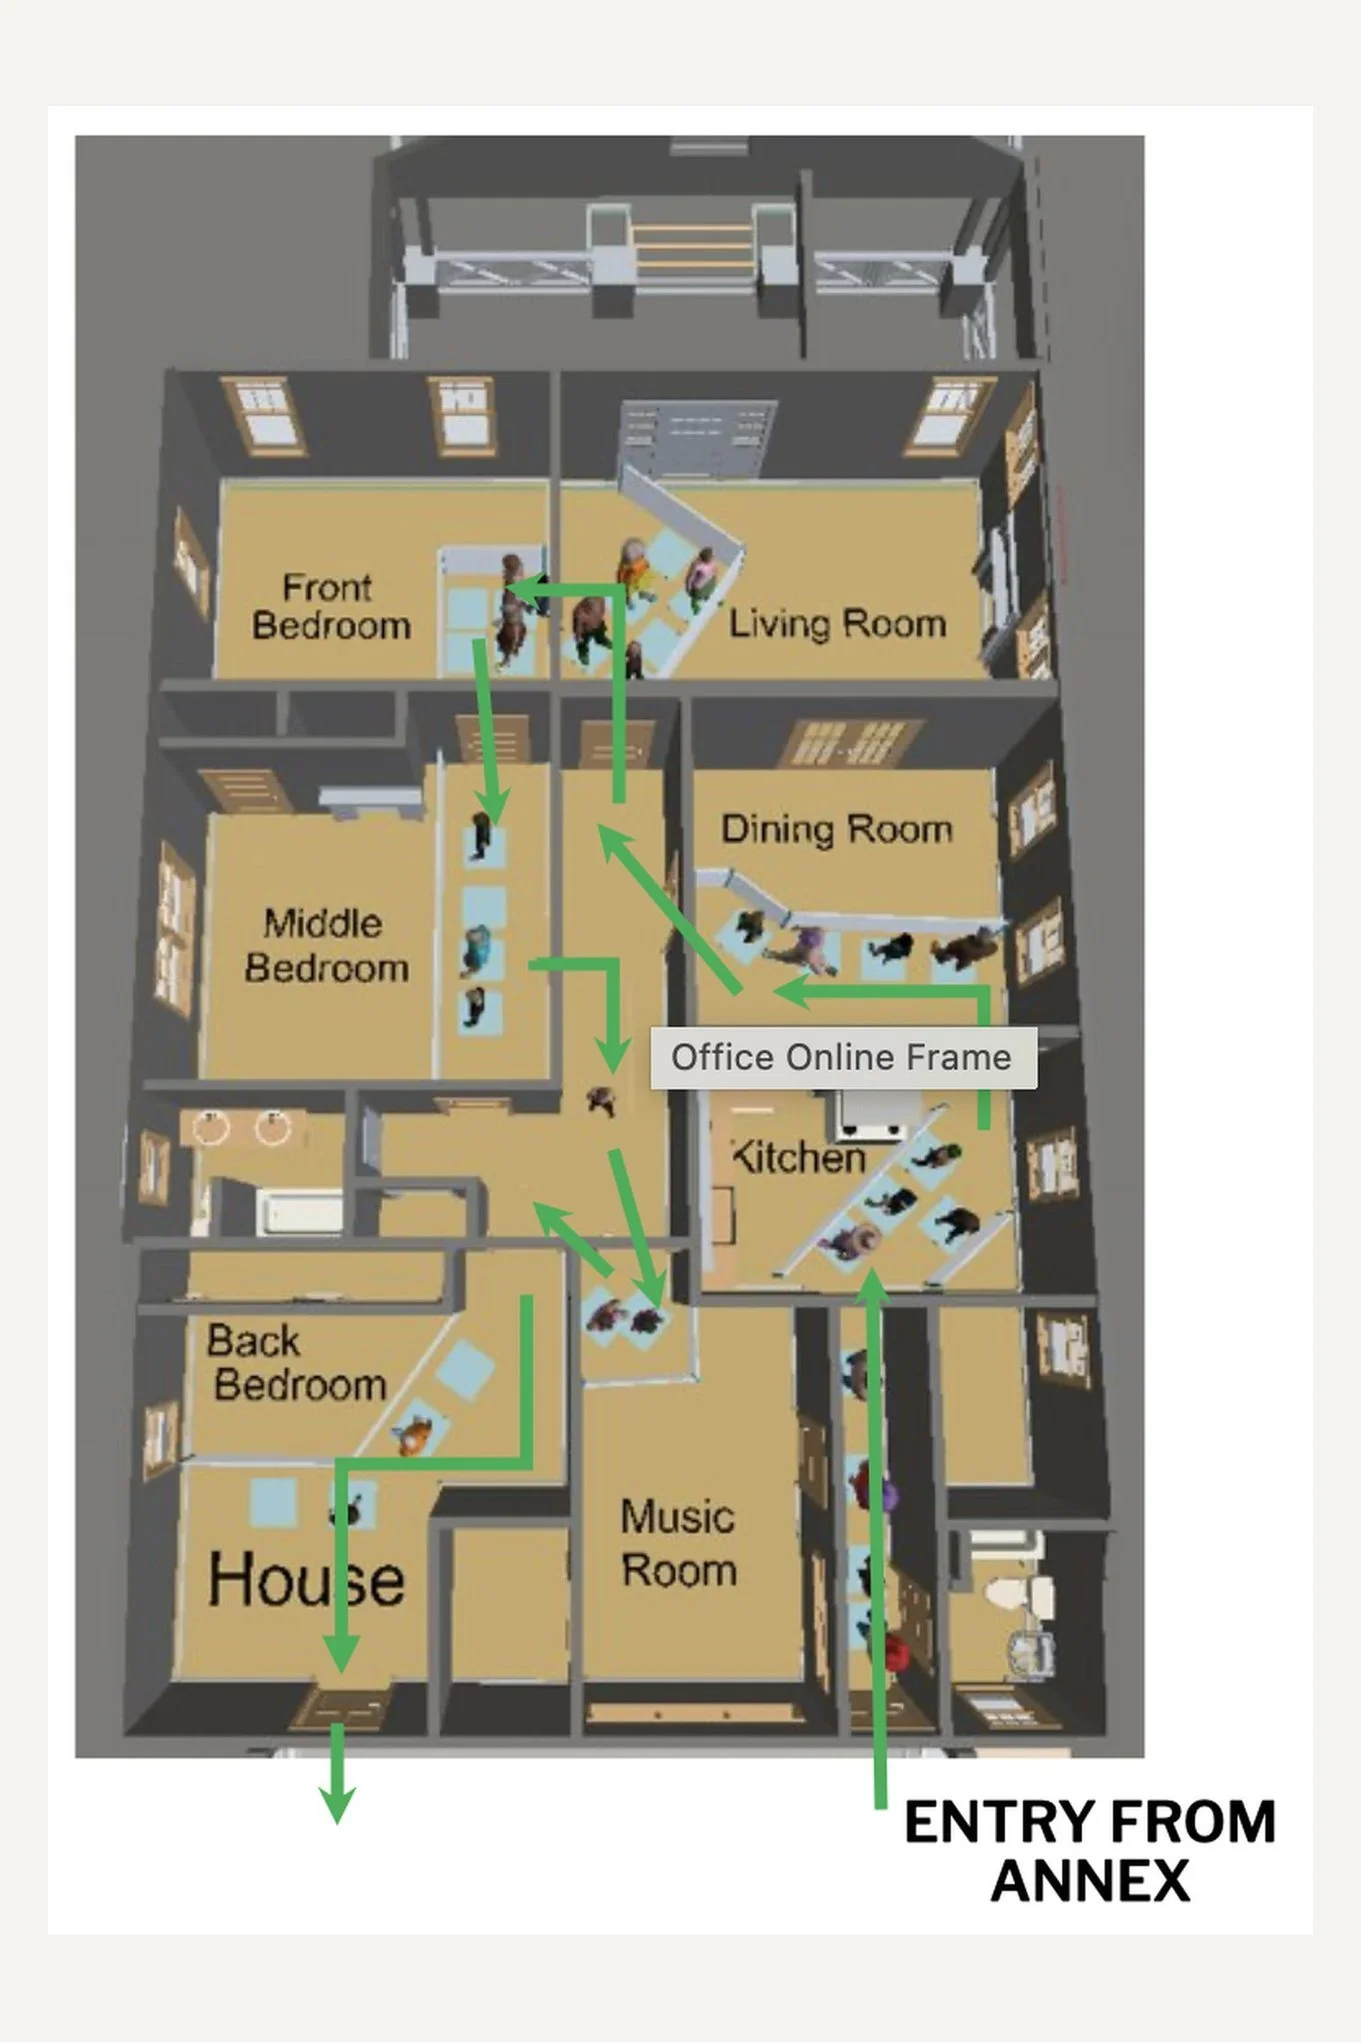
FIG. 05 — JACKSON HOME FLOOR PLAN WITH EXPECTED VISITOR PATHS
07
Scenario Testing
Study factors
Ticketing Window:
30-minute windows
15-minute windows
Arrival Pattern:
Random times within ticketing window
All arrive at start of ticketing window
Docent Control:
No constraint - visitors enter if there is space in the vestibule
With constraint - docent allows ~8 people at a time into entrance area (Vestibule, Pre 1965 and Video Wall)
Number of tickets:
Base: 48 per 30-minutes or 24 per 15-minutes
Low: 38 per 30-minutes or 20 per 15-minutes
High: 58 per 30-minutes or 28 per 15-minutes
Walk-up Visitors:
A limited number of un-ticketed visitors may be allowed to join the queue if the ticketed visitors have entered the building
Ticketing Window & Arrival Patterns
The effects of these factors are linked
If visitor arrivals are spread randomly through the ticketing window
Congestion and queue sizes are low
Visitors rarely have to skip exhibits
Total time spent on-site matches expectations
There is no significant difference between 30-minute or 15-minute ticketing windows
Ticketing Window & Arrival Patterns
If most visitors arrive close to the start of the ticketing window
Congestion and queue sizes are high
With no docent control at the entrance, skipping behavior balloons
This could result in many unhappy visitors!
Average time spent on-site increases by just a few minutes, but the maximum time on-site almost doubles!
In this case, all indicators are much better if 15-minute ticketing windows are used
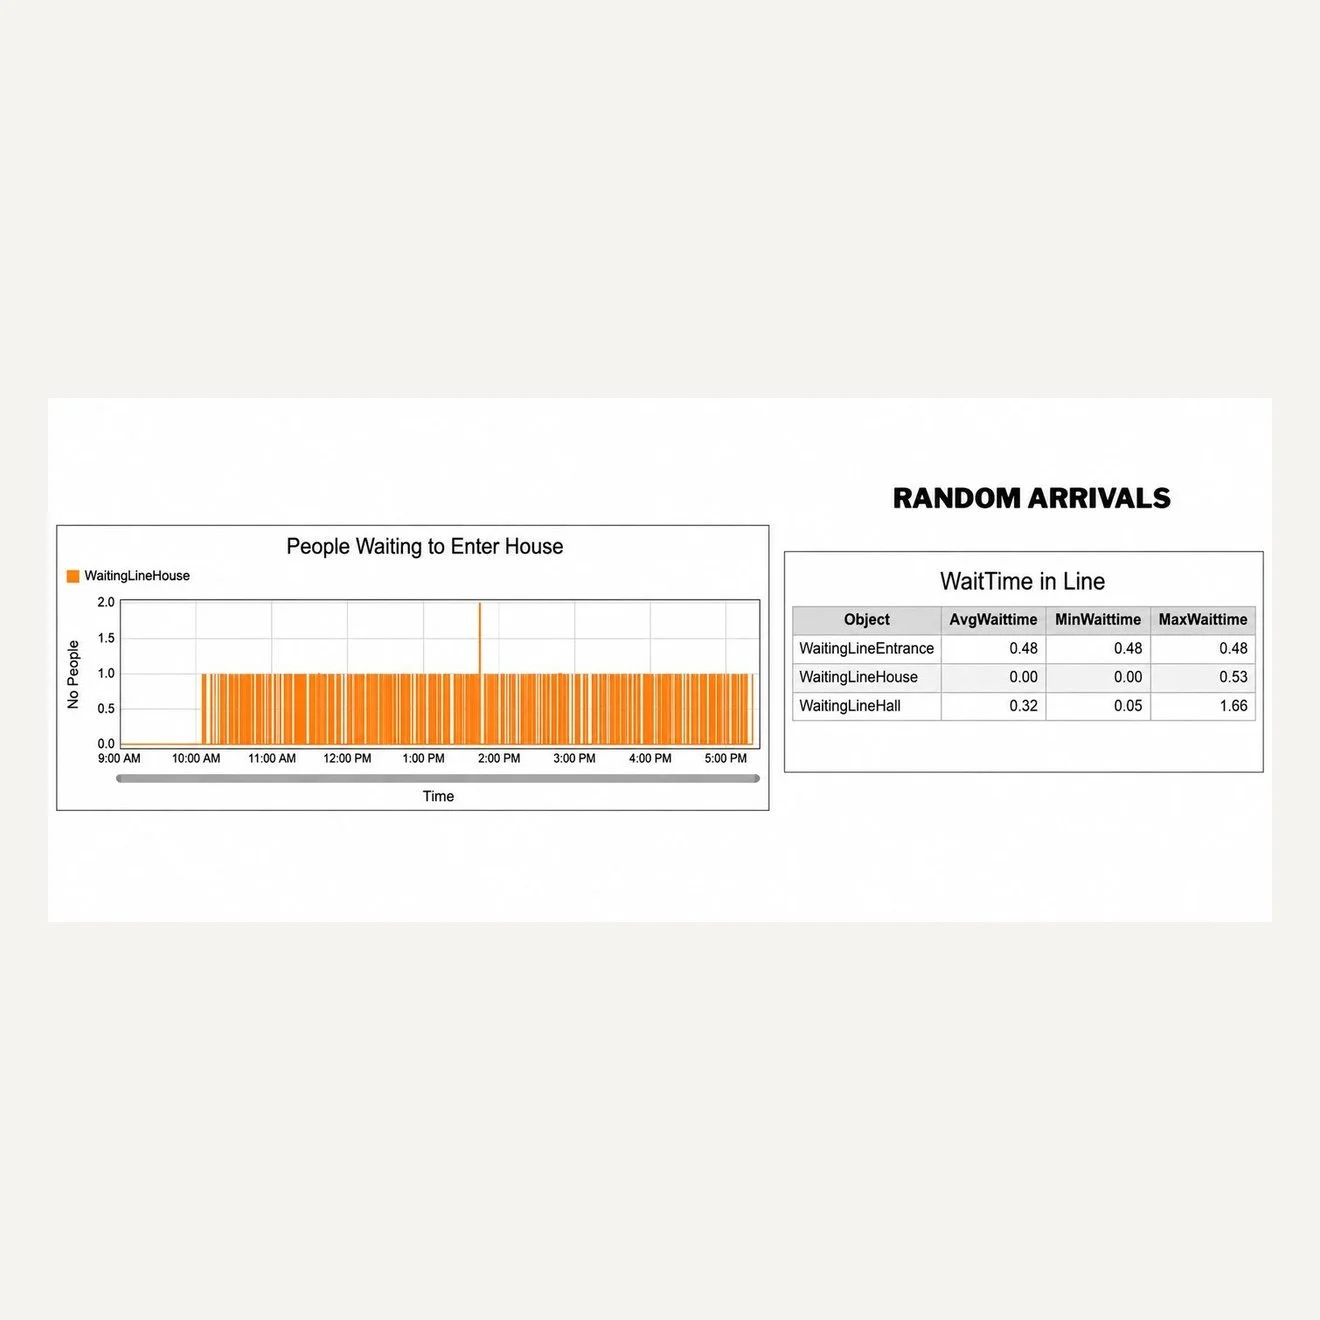
FIG. 06 — ARRIVALS SPREAD RANDOMLY THROUGH THE TICKETING WINDOW
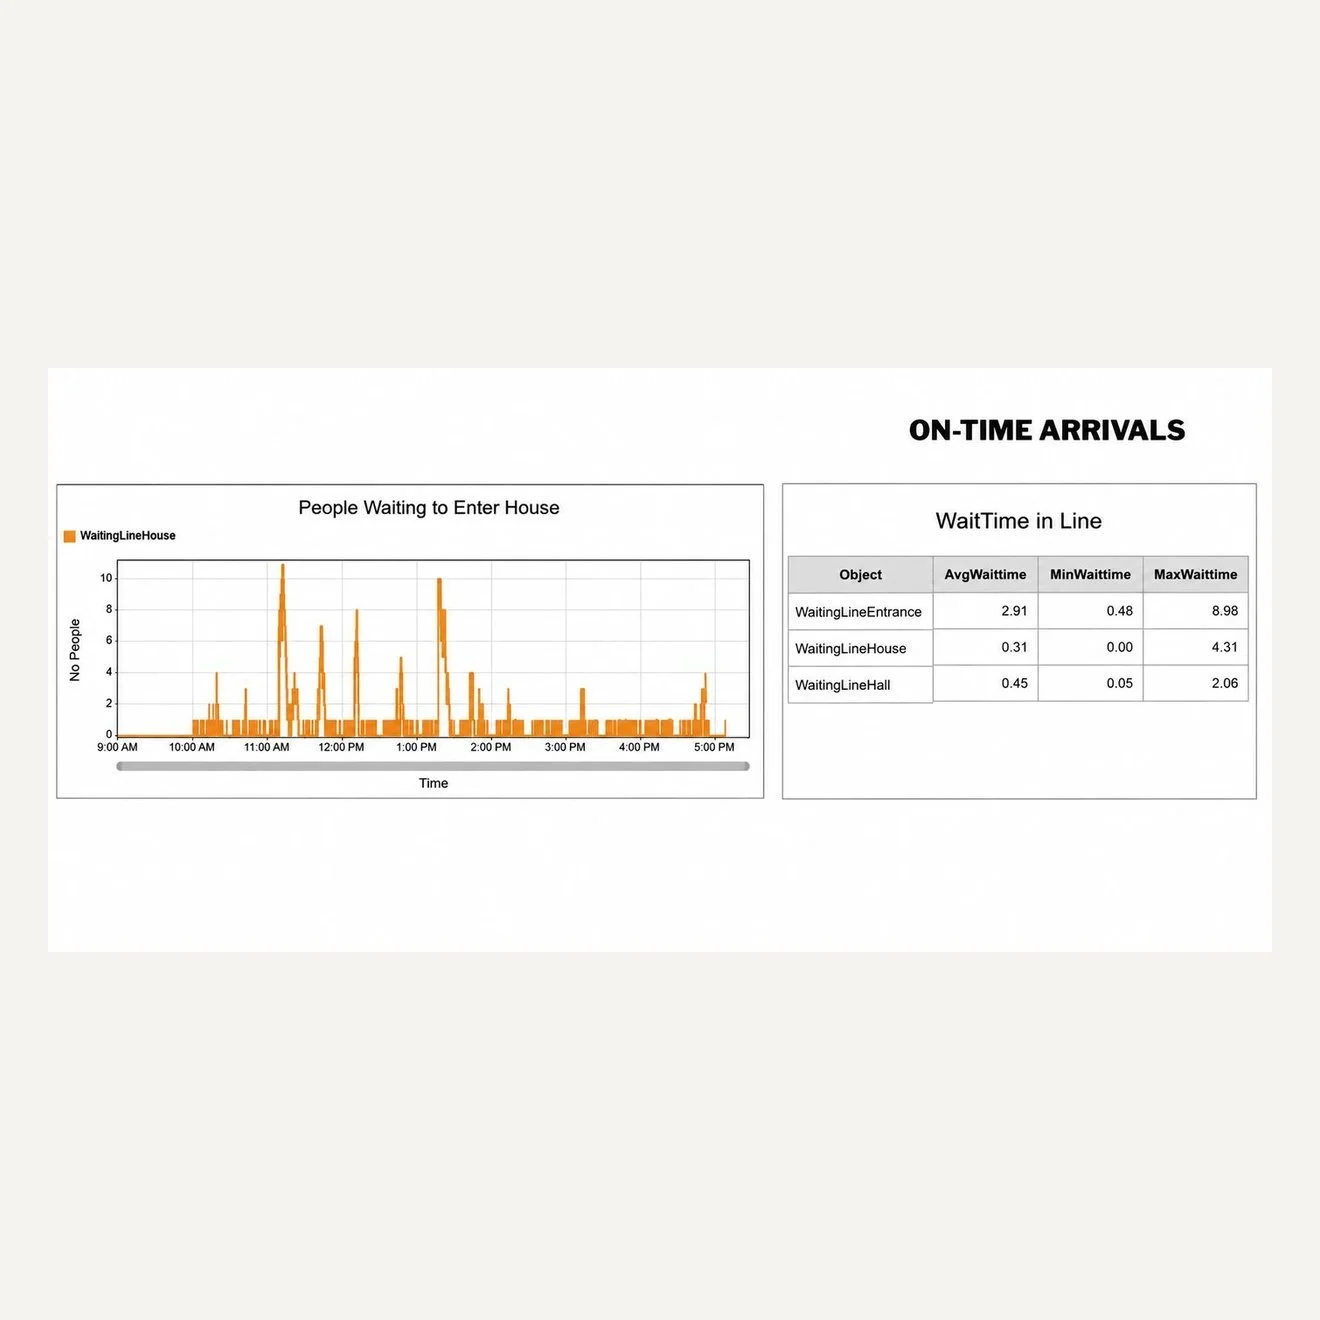
FIG. 07 — ARRIVALS AT THE START OF THE TICKETING WINDOW
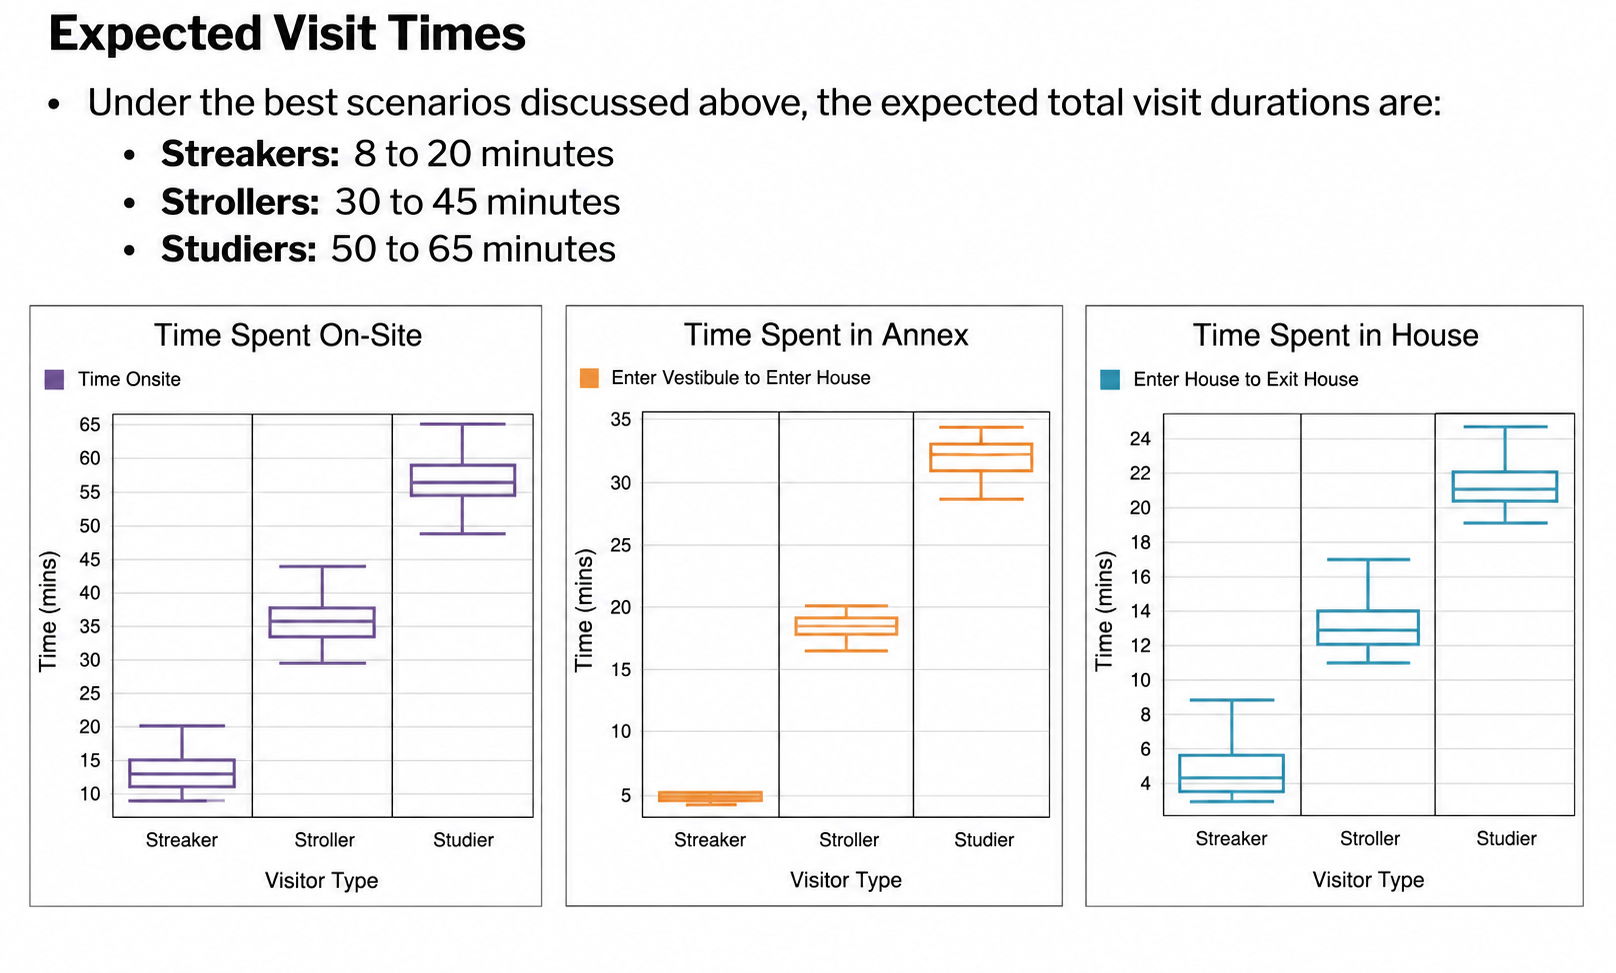
FIG. 08 — EXPECTED VISIT TIMES BY VISITOR TYPE
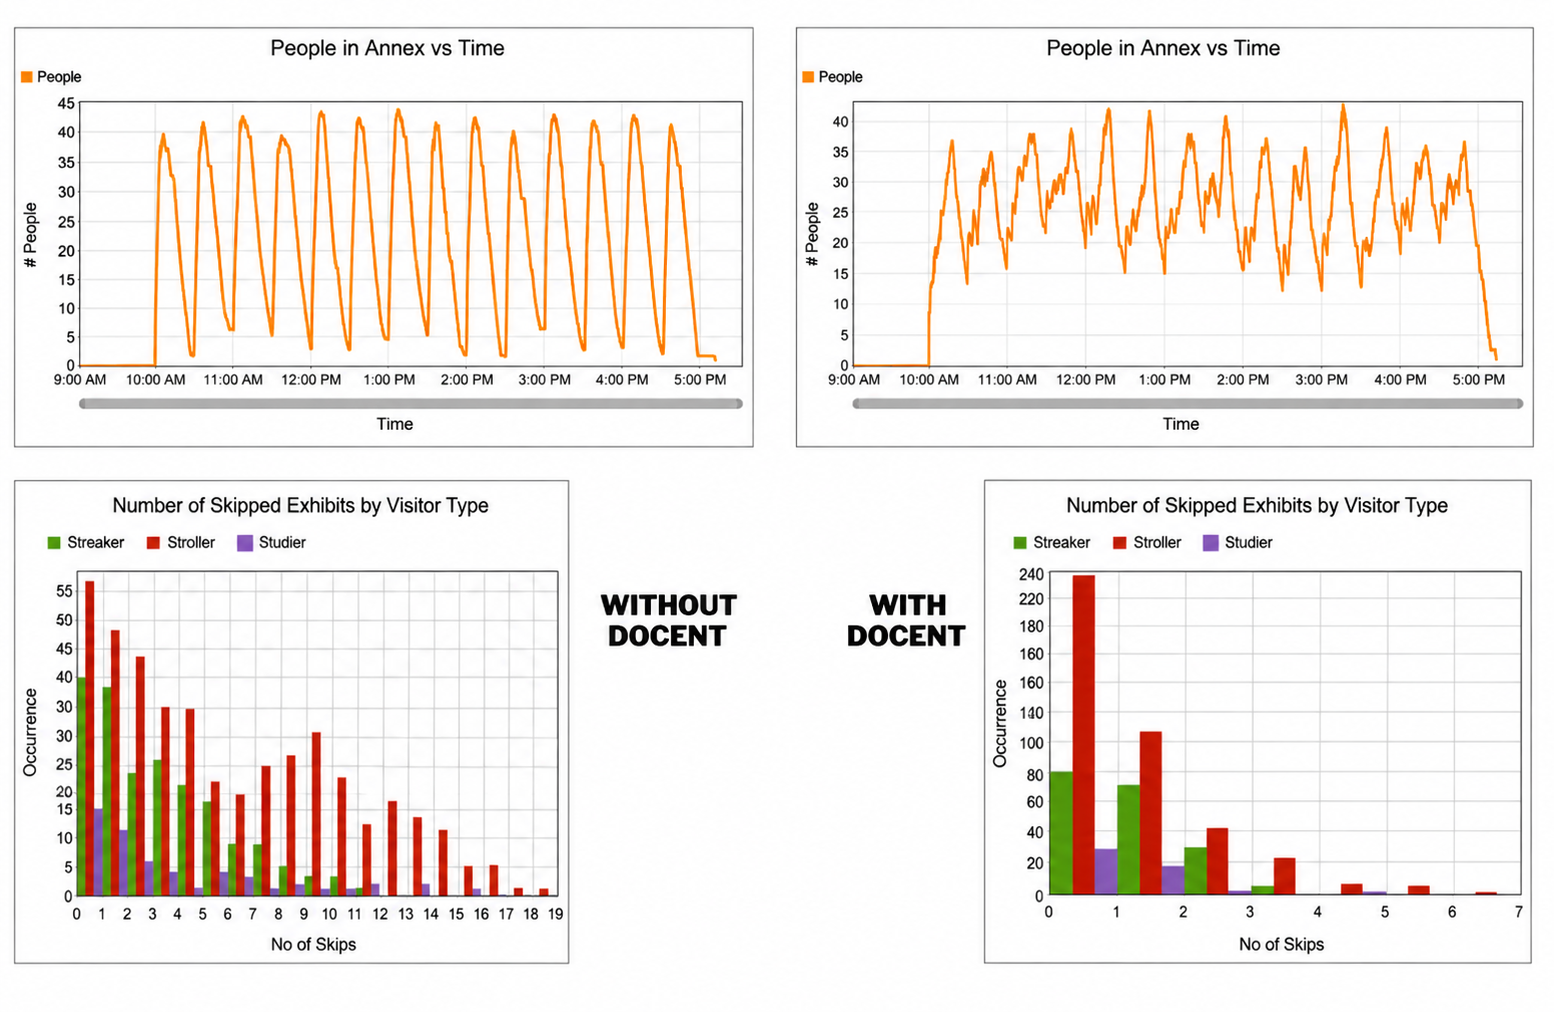
FIG. 09 — SKIPPED EXHIBITS, WITHOUT AND WITH DOCENT CONTROL
08
Findings
Ticketing Strategy
Visitors were expected to arrive near the beginning of their assigned ticket windows, particularly during the exhibition's opening months.
A 15-minute ticketing schedule distributed arrivals more evenly than 30-minute windows, reducing congestion throughout the home.
Capacity
While the home could accommodate a maximum of approximately 32 visitors every 15 minutes, a capacity of 30 visitors per entry window created a noticeably more comfortable visitor experience while maintaining operational efficiency.
Presenter Placement
Simulation results demonstrated that placing presenters near the first exhibits significantly improved visitor flow. Presenters helped regulate entry into high-demand spaces, reduced skipped exhibits, and minimized bottlenecks during periods of heavy attendance. The recommended staffing model included three to four presenters positioned throughout key zones of the home during opening operations.
Walk-Up Visitors
Allowing a controlled mix of ticketed and walk-up visitors naturally staggered arrivals, reducing congestion and average waiting times while increasing access for guests unable to reserve tickets in advance.
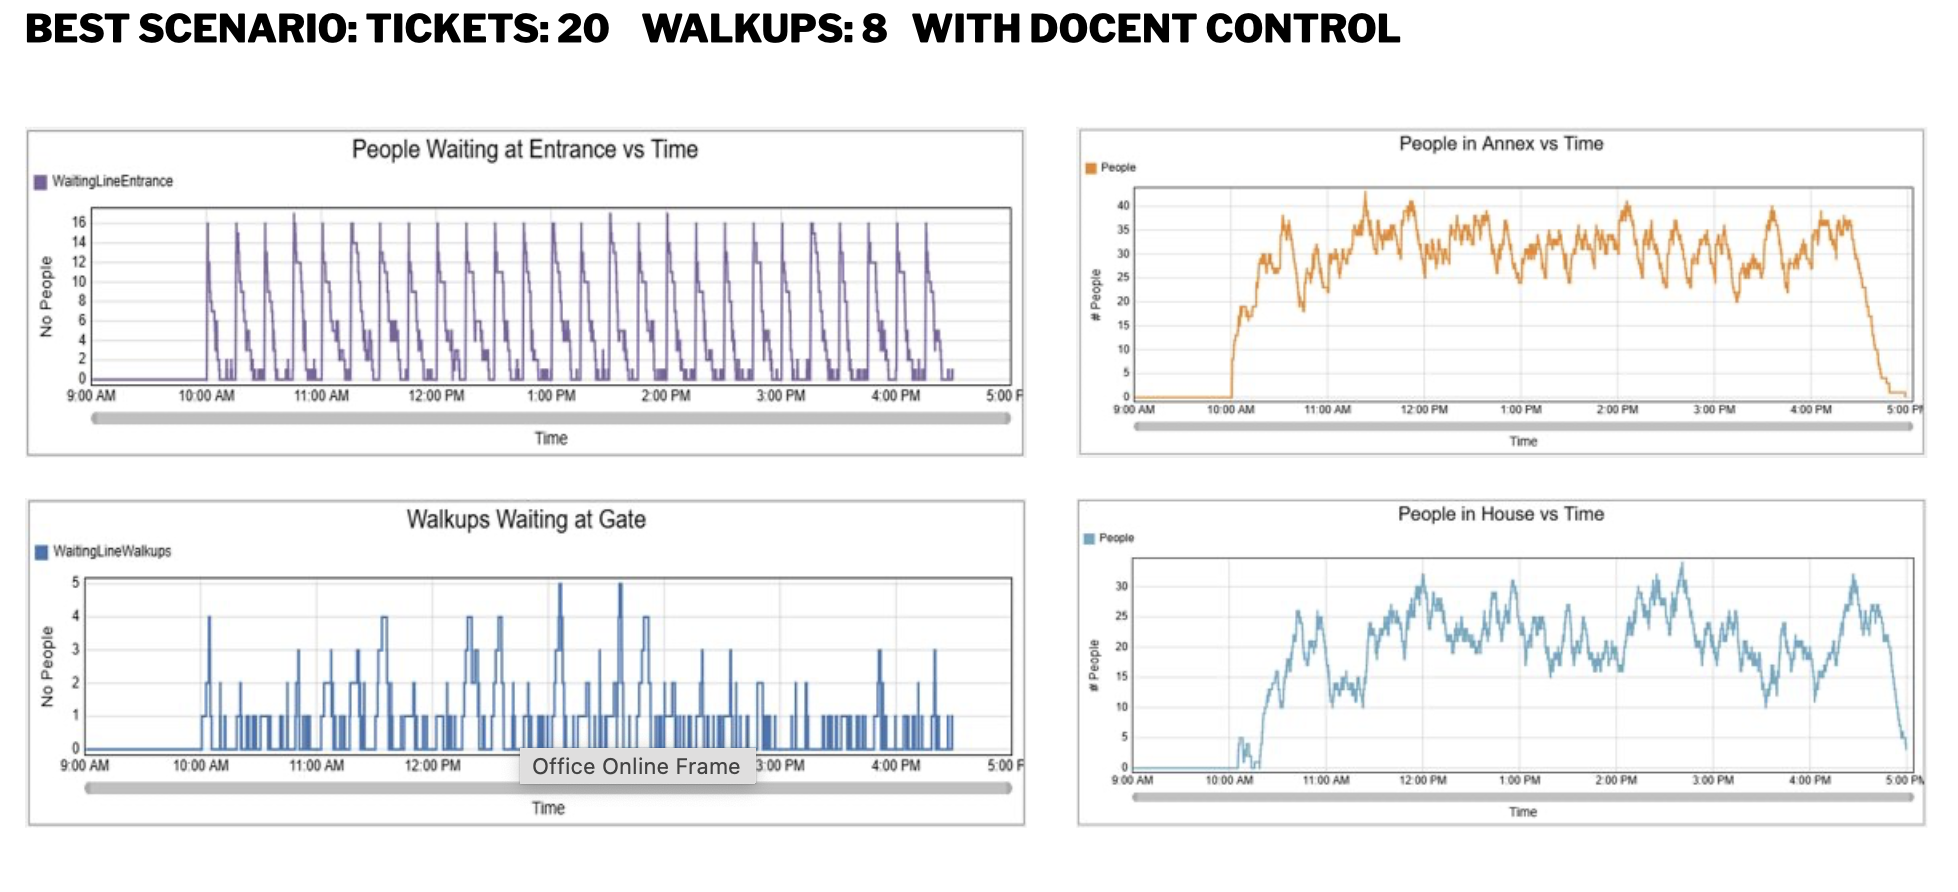
FIG. 10 — BEST SCENARIO: 20 TICKETS, 8 WALK-UPS, WITH DOCENT CONTROL
09
Impact
The visitor flow simulation provided stakeholders with evidence-based recommendations before the Jackson Home opened to the public. The research directly informed operational planning by helping teams:
establish ticketing schedules for opening operations
determine comfortable visitor capacity limits
identify high-congestion areas before opening
optimize presenter placement throughout the home
evaluate queue management strategies
improve visitor flow while preserving the historic integrity of the building
Rather than relying on assumptions alone, leadership was able to make operational decisions supported by predictive behavioral research and simulation.
10